US stock markets fall amid Iran strikes and potential higher interest rates
The Dow closed down 1.09%, or about 500 points, on Wednesday as US equities repriced geopolitical and rates risk in the same session.
Gareth Hopkins·updated July 09, 2026
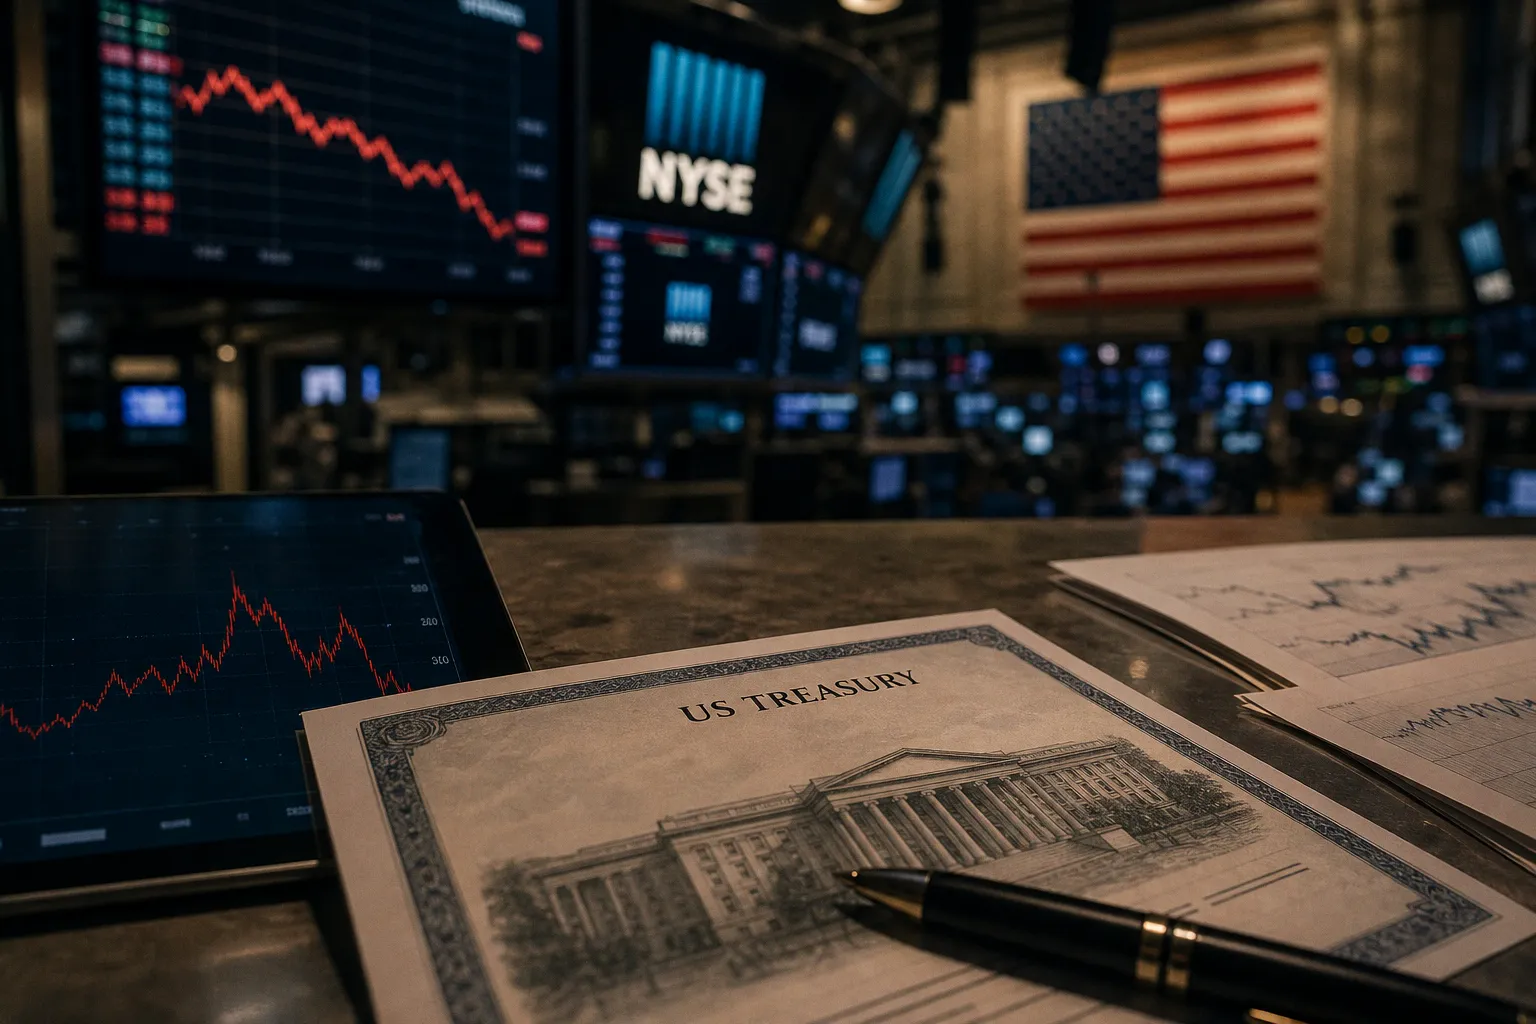
Cross-asset signal: oil beta rose first
The immediate market sequence was linear. The US continued strikes on Iran. Donald Trump said at the Nato summit in Ankara that the Iran-US ceasefire was over. Oil moved first. Equities followed with dispersion.
Key market prints from the session:
- Dow: -1.09%, around -500 points.
- S&P 500: small loss.
- Nasdaq: slightly higher.
- Brent crude: +5% plus, cresting $80 a barrel.
- FTSE 100: -1% earlier in the day.
- Nikkei: -2.1%.
The composition matters. A down Dow, flat-to-negative S&P 500, and marginally positive Nasdaq is not a full de-risking profile. It is a rotation profile with energy, inflation, and duration assumptions being recalibrated simultaneously. The market did not sell all long-duration exposure equally. It penalized cyclicals and broader index exposure more visibly than mega-cap technology.
That distinction is relevant for global-index allocators. A geopolitical oil shock does not transmit uniformly through benchmarks. It hits via energy import exposure, input costs, inflation expectations, and central-bank reaction functions. The index-level move is the output. Sector weights and revenue geography are the mechanism.
Fed path: higher-for-longer risk widened
The rates channel was the second driver. The Federal Reserve minutes showed limited discussion of near-term rate cuts. Some officials judged that the current target range of 3.5% to 3.75% could be maintained or lowered if inflation eased. Others indicated that rates may need to rise before year-end to address inflation.
The inflation backdrop was not benign in the cited data. The annualized US inflation rate rose to 4.2% in May, a three-year high and more than double the Fed’s 2% target. The minutes attributed higher total and core inflation to multiple inputs, including earlier tariff pass-through, higher energy and input costs tied to the Middle East conflict, and demand linked to the AI buildout.
This is the relevant equity discount-rate equation:
- inflation above target;
- energy shock adding variance;
- no clear near-term easing bias;
- possible further tightening before year-end;
- AI capex still absorbing capital and inputs.
That combination compresses the margin for multiple expansion outside the narrow group able to convert AI demand into revenues. It also increases the probability that equity index performance remains concentrated, even when headline benchmarks appear stable.
The IMF also cut its global economic growth forecast to 3% from 3.1% in April, citing conflict in the Middle East and pressured AI spending. Global growth averaged 3.5% in 2024 and 2025. That is a 50 basis-point gap versus the recent average. For equity markets, the implication is lower macro beta unless earnings revisions offset the discount-rate drag.
Index exposure: revenue geography is now a risk variable
Morningstar’s latest revenue-mapping work adds a structural layer to the session. Only 59% of US stock-market revenues now come from the US, down from 61% a year earlier. South Korea, Taiwan, China, Japan, and the Netherlands also became more international in revenue sources. The common factor identified: major AI-linked companies.
This makes national index labels less useful as standalone risk descriptors. A US allocation is not purely US demand. A Taiwan or Netherlands allocation is not purely local GDP. AI infrastructure, semiconductors, memory, data centers, oil, gold, and mining have increased the cross-border revenue load inside domestic benchmarks.
For practical positioning, the check is mechanical:
- measure index exposure by revenue source, not domicile only;
- separate AI revenue beneficiaries from AI cost bearers;
- stress portfolios for oil above the prior base case;
- test duration exposure against a Fed path with no near-term cut;
- compare broad-market beta with equal-weight or sector-neutral alternatives.
The same framework applies to non-equity risk assets where liquidity and sentiment are correlated with speculative capital flows, including NFT gaming and play-to-earn assets. The transmission is not identical, but the funding-rate and risk-budget channel is shared.
Technical pivot is now rates-oil covariance. If crude holds the session’s higher range while Fed-cut probability remains suppressed, broad equity mean reversion requires either earnings resilience or lower inflation variance. Without that, index upside remains dependent on narrow Nasdaq support rather than broad participation.