India's GDP growth rate: Why it shifted over the last 10 years
India’s GDP growth rate over the last 10 years has not followed a clean upward line. Treat it as a sequence of shocks, resets, base effects, and sector rotations.
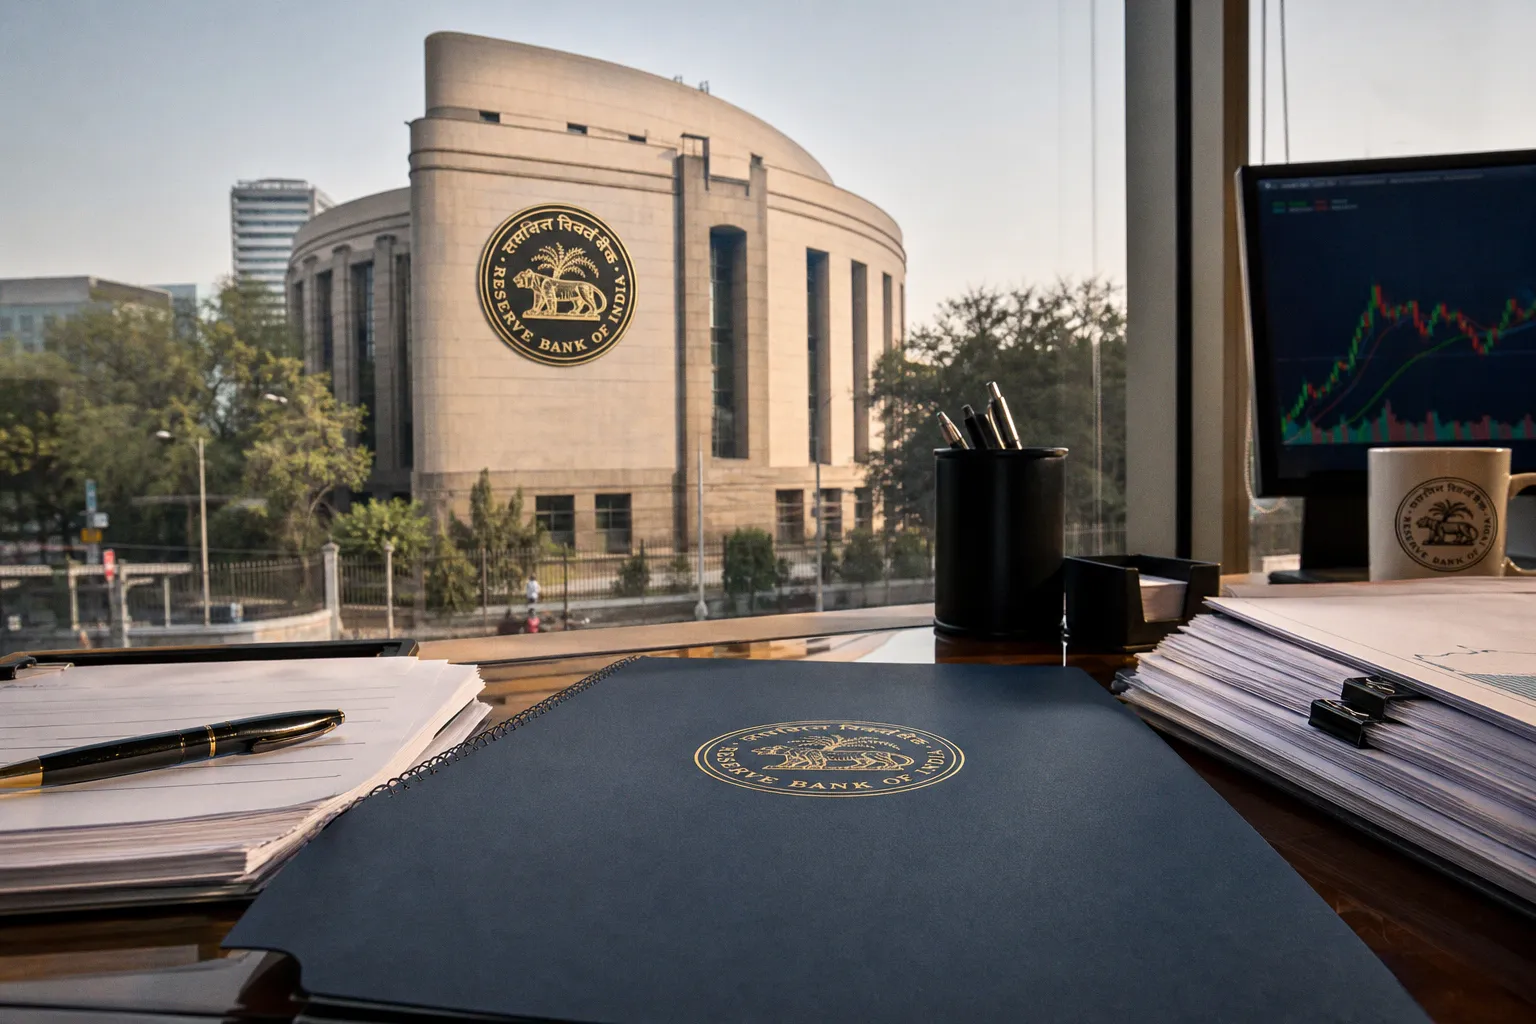
The operating reality is sharper. The economy moved through demonetization in 2016, GST implementation in 2017, a pandemic contraction of 5.8% in FY 2020-21, a rebound of 8.3% in FY 2021-22, and another strong expansion of 8.2% in FY 2023-24. Those numbers matter, but the sequence matters more. Growth changed because the transmission channels changed: cash liquidity, tax formalization, global supply chains, fiscal support, construction activity, manufacturing output, food inflation, fuel volatility, and RBI policy all pulled the cycle in different directions.
The decade was not one cycle. It was several regimes.
Investors must stop reading the Indian economy growth rate over 10 years as a single macro story. It was at least four regimes.
First came the disruption-and-formalization phase around demonetization and GST. Then came the pre-pandemic slowdown, where growth momentum was already under pressure before COVID-19 hit. Then came the pandemic collapse and mechanical rebound. Finally, the post-pandemic expansion shifted toward infrastructure, construction, manufacturing, and public-capex-linked activity.
That distinction is not academic. It changes how you price earnings, duration, credit risk, and currency exposure. A GDP print driven by a reopening rebound is not the same as one driven by durable private investment. A number supported by construction and manufacturing does not carry the same sector implications as one led by consumption or services.
| Period | Main growth regime | Market implication |
|---|---|---|
| 2016-2017 | Cash disruption and tax-system reset | Higher friction for informal activity; formal businesses gain relative advantage |
| 2017 onward | GST normalization | Better tax integration over time, but adjustment costs for small firms |
| FY 2020-21 | Pandemic contraction | Demand shock, supply disruption, balance-sheet stress |
| FY 2021-22 | Rebound from low base | High headline growth, but quality requires scrutiny |
| FY 2023-24 | Manufacturing and construction-led expansion | Stronger support for industrials, materials, infrastructure-linked credit |
The key instruction is simple: adjust exposure based on the source of growth, not the headline rate alone.
GDP is not a trading signal. It is a map of which cash flows deserve a higher multiple and which ones are riding temporary liquidity.
Structural transformations: demonetization and GST changed the transmission system
The 2016 demonetization exercise and the 2017 implementation of the Goods and Services Tax were not ordinary policy events. They changed the plumbing of the Indian economy. They affected liquidity, compliance behavior, transaction visibility, and the relative position of formal versus informal firms.
Demonetization created a near-term liquidity shock. Cash-dependent sectors faced friction. Small merchants, informal labor channels, rural transactions, and working-capital-light businesses absorbed the immediate pressure. Do not overstate the precision here. The exact informal-sector impact is difficult to measure because informal activity is, by definition, weakly captured in official data. But portfolios must recognize the direction of the shock: cash velocity was interrupted.
GST created a different adjustment path. It moved India toward a more unified indirect tax structure, but implementation created compliance costs. Larger firms with accounting systems, tax teams, and supply-chain discipline adapted faster. Smaller firms faced a steeper operating burden. That matters because GDP can recover while margin distribution changes across listed and unlisted businesses.
For equity allocation, the practical framework is:
1. If formalization accelerates, favor firms with scale and compliance capacity. Tax integration tends to reward companies that can document input credits, manage interstate logistics, and absorb reporting costs.
2. If cash liquidity tightens, reduce exposure to segments dependent on informal working capital. The risk is not only lower demand. It is settlement friction.
3. If policy disruption fades, watch volume recovery before margin recovery. A sector can show activity normalization while profitability remains uneven.
4. If listed firms gain share from informal competitors, do not confuse market-share transfer with broad demand strength. That distinction protects you from overpaying for cyclical earnings.
The shift in India’s historical GDP growth was therefore not just about whether policy was “good” or “bad.” That framing is too blunt for capital allocation. The correct question is operational: which sectors absorbed friction, which sectors gained share, and which balance sheets could finance the transition.
The pandemic shock: the 2020-21 contraction was a break in the series
FY 2020-21 was not a normal recession. India’s GDP contracted by 5.8% as the COVID-19 pandemic hit mobility, services, supply chains, labor availability, and confidence. That print should be treated as a break in the series rather than a simple cyclical trough.
When a large economy contracts at that scale, the next year’s growth rate will carry a base effect. India grew 8.3% in FY 2021-22. That rebound was significant, but investors must separate arithmetic recovery from durable trend growth. A high growth rate after a contraction does not automatically mean the economy has returned to its pre-shock path.
This is where careless analysis leads to bad positioning. If you looked only at the 8.3% number, you could over-allocate to high-beta domestic cyclicals without assessing whether household income, employment intensity, small-business credit, and consumption depth had normalized. If you looked only at the prior contraction, you could under-allocate and miss the reopening impulse. Both errors come from treating GDP as a single-point signal.
Use an if/then discipline:
- If growth is driven by reopening, then demand-sensitive sectors may rally before balance sheets fully heal. Hedge downside where leverage is high.
- If growth is driven by government spending and infrastructure, then industrials and materials have better earnings visibility than broad discretionary consumption.
- If growth is driven by low-base effects, then do not extrapolate the rate into a multi-year earnings model without a discount.
- If private capex broadens, then upgrade the durability of the cycle. Until then, keep duration and cyclicality under control.
The pandemic also changed global conditions around India. Supply-chain diversification, energy volatility, monetary tightening abroad, and risk appetite toward emerging markets all affected capital flows. Do not isolate India’s GDP path from the global macro tape. The domestic story is strong, but it does not trade in a vacuum.
The 8.2% FY 2023-24 expansion was sector-specific, not generic
India’s 8.2% GDP growth in FY 2023-24 was a powerful print. The important detail is the composition. Strong performance in manufacturing and construction helped drive the expansion. That is a different signal from consumption-only growth.
Manufacturing strength matters because it connects to capacity utilization, exports, import substitution, supply-chain investment, and operating leverage in listed companies. Construction matters because it transmits through cement, steel, labor, transport, housing materials, infrastructure contractors, and state-level fiscal activity. These sectors create broad multiplier effects, but they also carry execution and financing risks.
For portfolios, manufacturing and construction-led growth requires a different risk map:
| Growth driver | What it supports | Main risk to monitor |
|---|---|---|
| Manufacturing | Industrials, capital goods, logistics, select banks | Global demand weakness, input-cost volatility |
| Construction | Cement, steel, infrastructure contractors, real estate-linked credit | Financing stress, project delays, state capex variability |
| Public infrastructure spending | Order books, working capital cycles, equipment demand | Fiscal slippage, delayed payments |
| Formal-sector consolidation | Listed large-cap revenue share | Valuation crowding, weak informal-sector employment absorption |
This is where the “why India GDP growth rate changed” question becomes investable. The economy is not merely recovering from COVID-19. It is showing stronger activity in sectors tied to physical investment. That improves visibility for some earnings streams, but it also concentrates risk. If construction slows, the second-order effects will not be contained to real estate. They will hit materials, credit demand, transport volumes, and local employment.
Treat India’s growth premium as conditional. It holds only while sector breadth, inflation control, and financing channels stay aligned.
Inflation and the RBI: the growth rate cannot be read without CPI
India’s retail inflation has frequently fluctuated around the Reserve Bank of India’s target band of 4%, with tolerance of plus or minus 2 percentage points. Food and fuel prices are the recurring stress points. This is not a footnote. It is central to how growth translates into market returns.
High nominal activity can coexist with pressure on real household income. If food inflation rises, lower- and middle-income consumers lose discretionary capacity. If fuel volatility persists, transport costs and input costs move through corporate margins. If inflation stays uncomfortable, the RBI has less room to support growth through easier policy.
The practical consequence is direct: portfolios require an inflation overlay. GDP growth without CPI discipline can produce weak real returns in rate-sensitive assets. It can also compress equity multiples if bond yields rise or remain sticky.
Monitor the inflation-growth mix in three layers:
1. Headline CPI versus the RBI band. If inflation moves persistently toward the upper side of the tolerance range, reduce reliance on rate-sensitive multiple expansion.
2. Food inflation pressure. If food prices are driving CPI, consumption quality weakens even when headline GDP remains firm.
3. Fuel and imported cost pressure. If energy volatility lifts input costs, review margin assumptions for transport, chemicals, consumer goods, and manufacturing.
The RBI’s position matters because policy credibility anchors the domestic cost of capital. When inflation is contained, growth can be valued with more confidence. When inflation is unstable, discount rates become less forgiving. This is the mechanical link between macroeconomic indicators and portfolio construction.
Do not assume strong GDP growth neutralizes inflation risk. It does not. In India, food and fuel volatility can quickly change the policy conversation, especially when growth is already above many large-economy peers. The central bank’s task is not to celebrate growth. It is to keep the system from overheating or losing purchasing-power stability.
Policy effects and global trends cannot be cleanly separated
A common error is to assign each movement in India’s GDP growth rate to a single domestic policy. That is too clean. It is also wrong for risk management.
Demonetization and GST affected the economy. The pandemic affected it more violently. Global oil prices, supply-chain disruption, external demand, foreign capital flows, US rates, and commodity costs also influenced the path. The last decade was not a controlled experiment. Investors must use attribution bands, not absolute claims.
For example, GST may have improved formalization and tax efficiency over time, but short-term compliance friction affected small firms. Demonetization may have accelerated digital payments and formal transactions, but it also disrupted cash-heavy activity. The pandemic rebound may have produced strong GDP prints, but base effects inflated the apparent speed of recovery. Manufacturing strength in FY 2023-24 may signal deeper industrial momentum, but it still depends partly on global demand and input costs.
This is how to separate signal from noise:
- Policy signal: tax compliance, formal-sector share, public capex, infrastructure execution, digital transaction depth.
- Global signal: oil, external demand, supply-chain relocation, developed-market rates, dollar liquidity.
- Domestic demand signal: retail sales, wage growth, consumer confidence, housing activity, credit growth.
- Inflation signal: CPI composition, food prices, fuel pressure, RBI communication.
A disciplined investor does not need perfect attribution. You need enough clarity to recalibrate exposure before the earnings cycle reprices.
Employment and consumption: do not overread GDP
GDP growth does not automatically equal employment growth. In India, the relationship is complicated, and debates over jobless growth remain relevant. This matters because consumption durability depends on income breadth, not only aggregate output.
A manufacturing or construction-led expansion can support employment, but the quality and persistence of that employment vary. Construction can absorb labor quickly, but it is cyclical and project-dependent. Manufacturing can build durable wage channels, but only if capacity expansion, exports, and domestic demand hold together. Services can provide high-value growth, but not all services employment supports broad mass consumption equally.
For allocation, separate three questions:
1. Is GDP expanding? The headline tells you direction.
2. Is income spreading across households? That tells you consumption durability.
3. Are listed companies gaining share while informal activity lags? That tells you equity-market performance may outpace ground-level income recovery.
This distinction protects you from a common emerging-market mistake: assuming macro growth automatically flows into every consumer-facing sector. It does not. Premium consumption, mass consumption, rural demand, and credit-driven discretionary demand can diverge for long periods.
If wage growth and employment breadth lag while GDP remains strong, adjust exposure toward sectors tied to investment and formal market share rather than broad household spending. If income data improves alongside GDP, then consumption exposure becomes more defensible.
What the last decade means for current positioning
The last 10 years show that India’s GDP growth rate is resilient but not smooth. The economy absorbed policy resets, a pandemic contraction, inflation volatility, and global shocks. It then delivered strong post-pandemic growth, including 8.2% in FY 2023-24, supported by manufacturing and construction.
That combination deserves respect, not complacency. India can sustain a growth premium, but portfolios must price the moving parts correctly. The tactical posture should be selective, not euphoric.
If manufacturing momentum holds, maintain exposure to industrial supply chains and capital goods with pricing power. If construction remains strong, keep watching cement, steel, infrastructure execution, and credit quality. If CPI pressure rises toward the upper side of the RBI band, hedge duration risk and reduce dependence on multiple expansion. If global oil or dollar liquidity turns adverse, reassess external balances and foreign-flow sensitivity.
The growth story is still intact. The risk is that investors treat it as linear.
Risk parameters to monitor now
- GDP composition: Confirm whether growth is broadening beyond manufacturing and construction or becoming too concentrated.
- CPI versus the RBI band: Persistent food or fuel pressure changes rate expectations and household purchasing power.
- Private capex depth: Public infrastructure spending is useful, but durable growth requires broader private investment.
- Employment and wage transmission: Strong output without income breadth limits consumption quality.
- Credit conditions: Watch bank lending standards, infrastructure financing, and real-estate-linked exposure.
- External shocks: Oil, US rates, dollar liquidity, and global demand can still override domestic momentum.
- Valuation discipline: Do not pay peak multiples for sectors where growth is policy-supported but margin visibility is weak.
India’s GDP growth rate shifted because the economy’s operating system shifted. Formalization, pandemic disruption, inflation management, sector rotation, and global capital conditions all changed the growth path. Allocate accordingly: own the durable channels, hedge the macro variables, and do not mistake a strong headline print for a risk-free cycle.