China GDP growth rate: Official NBS vs. Li Keqiang Index
China's official GDP growth target for 2024, set at "around 5%" during the National People's Congress, sits at the center of an enduring methodological debate that extends far beyond Beijing's legislative chambers.
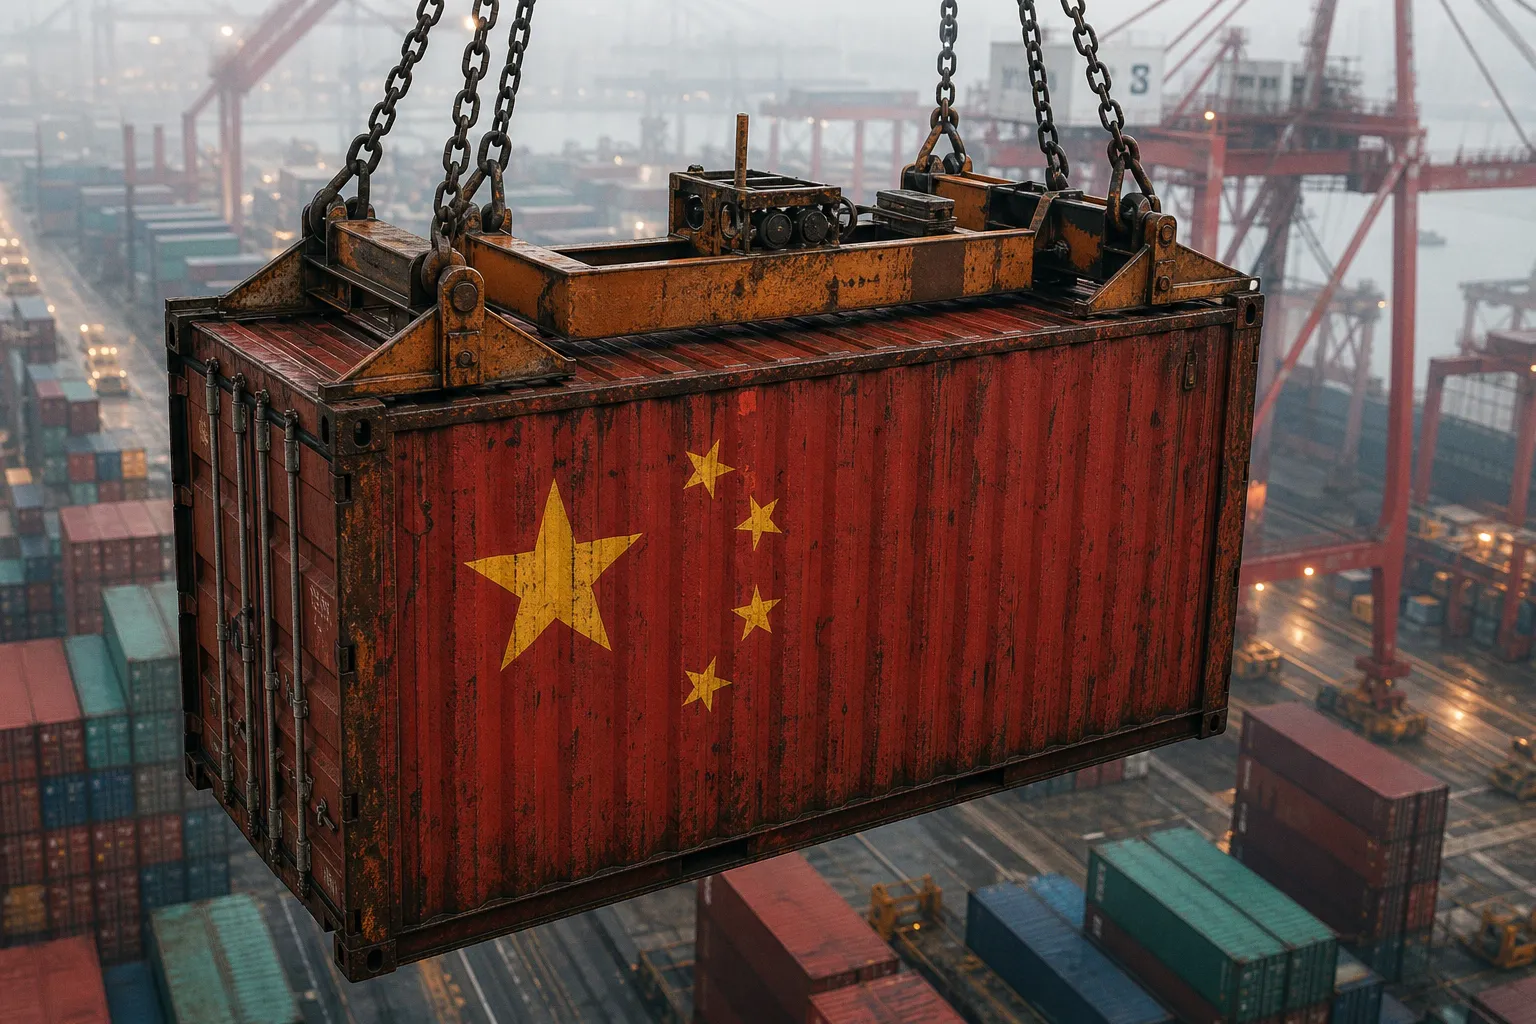
The Mechanics of Official NBS Reporting: A Production-Based Architecture
To understand why discrepancies persist, we must first examine the NBS's preferred methodology. Unlike the United States, the United Kingdom, or Japan, which predominantly rely on expenditure-based GDP calculations anchored in consumer spending, investment, and net exports, China's statistical apparatus leans heavily on a production-based approach. Under this framework, GDP is tallied by summing value-added output across sectors — agriculture, industry, construction, and services — with quarterly releases serving as the primary cadence for market-moving data.
Given the mandate to deliver stable, politically digestible growth trajectories, the production-based method offers structural advantages for smoothing volatility. Output can be aggregated from enterprise-level reporting and administrative records that flow upward through provincial statistical bureaus, producing figures that appear resilient even when high-frequency indicators flash warning signals. Historically, discrepancies between provincial GDP data and national aggregates have been a source of friction within the Chinese statistical system itself; so contentious did these inconsistencies become that the NBS moved to centralize the accounting process in recent years, tightening the chain of custody between local reporting units and the national tally.
Official Chinese GDP, as currently constructed, is less a real-time thermometer and more a retrospective consensus — a number built to endure revision, not volatility.
This is not to suggest methodological illegitimacy. Production-based GDP is a legitimate statistical convention, and its quarterly release schedule provides predictability that expenditure-based systems, reliant on survey data and consumer diaries, sometimes lack. The concern for the external analyst is not that the NBS fabricates figures, but that the architecture is inherently less sensitive to short-term dislocations — precisely the kind of dislocations that matter most when calibrating exposure to Chinese equities, the renminbi, or the broader EM complex.
Origins of the Li Keqiang Index: Beyond the Official Narrative
In 2010, a tranche of diplomatic cables released by WikiLeaks introduced the global investment community to a remarkably candid assessment of Chinese economic data. The cable in question reportedly quoted Li Keqiang — then a vice-premier ascending toward the premiership — expressing a preference for tracking electricity consumption, rail cargo volume, and bank lending disbursements over headline GDP figures. The disclosure was not merely a diplomatic embarrassment; it became the seed from which the Li Keqiang Index grew as an informal proxy metric, widely adopted by sell-side desks, hedge fund analysts, and sovereign credit researchers seeking to triangulate the true pulse of Chinese economic activity.
The elegance of the proxy lies in its directness. Electricity consumption captures the energy intensity of industrial production and, increasingly, services activity. Rail cargo volume reflects the throughput of commodities, manufactured goods, and bulk materials moving across China's vast logistical network. Bank lending, measured through aggregate loan disbursements, signals the credit pulse feeding both state-owned enterprises and private sector borrowers. When these three indicators move in concert, the resulting composite historically has demonstrated a tighter correlation with on-the-ground economic conditions than the official NBS aggregate, particularly during episodes of structural transition.
Deconstructing the Proxy: Electricity, Rail, and Lending
The analytical weight assigned to each component of the Li Keqiang Index is not officially standardized; practitioners have adopted varying calibrations, though a commonly cited construct allocates approximate weightings of 40% to electricity consumption, 25% to rail cargo volume, and 35% to bank loans. We can observe in this weighting scheme a deliberate emphasis on the industrial and credit channels that powered China's export-led growth model through the 2000s and early 2010s.
| Component | Analytical Signal | Approximate Weight | Structural Sensitivity |
|---|---|---|---|
| Electricity consumption | Industrial output energy intensity | ~40% | High to manufacturing cycles |
| Rail cargo volume | Logistics throughput, commodity flow | ~25% | High to heavy industry, construction |
| Bank lending disbursements | Credit expansion to SOEs and private sector | ~35% | High to monetary policy stance |
The table above is not a literal transcription of any official document — indeed, the Li Keqiang Index carries no official imprimatur — but rather a functional representation of how analysts have historically decomposed the proxy. Each component captures a distinct transmission channel: electricity reflects the physical substrate of production, rail cargo captures the circulatory system of goods distribution, and bank lending measures the financial oxygen flowing through the economy.
The Li Keqiang Index is, in essence, a credit-cycle indicator dressed in the clothing of an industrial metric — and therein lies both its explanatory power and its emerging limitation.
Structural Shifts and the Decoupling of Traditional Metrics
The principal analytical challenge confronting the Li Keqiang Index in the current decade is structural transformation. China's economy has progressively migrated toward a services-dominated model, with the tertiary sector now contributing a majority share of output. Services activity is, by its nature, less electricity-intensive per unit of GDP than heavy manufacturing; a software firm, a financial advisory practice, or a logistics platform consumes a fraction of the kilowatt-hours that a steel mill or aluminum smelter demands for equivalent value-added.
Consequently, we face a methodological paradox: as China's growth composition shifts toward the very sectors that the proxy was least designed to capture, the Li Keqiang Index risks understating genuine economic dynamism. Electricity consumption growth may decelerate not because the economy is contracting, but because the marginal yuan of GDP is being generated in lower-intensity sectors. Rail cargo volumes similarly face headwinds from a construction cycle that has cooled meaningfully from its 2010s peak. Even bank lending data has been complicated by the rise of shadow finance, wealth management products, and off-balance-sheet credit channels that the traditional proxy does not fully incorporate.
We can observe this decoupling empirically in recent quarters. There have been periods when electricity consumption and rail cargo have softened relative to the official GDP figure, prompting heated debate over whether the official number is too high or the proxy is too low. The honest analytical position is that both can be simultaneously correct within their respective measurement frameworks — the NBS capturing a broadening services base that the proxy underweights, while the proxy captures industrial and credit channels that the official figure may smooth through methodological choices.
Navigating the Discrepancy in Modern Economic Forecasting
For the institutional practitioner, the question is not which dataset is "right" — a framing that invites unproductive ideological warfare — but how to construct a triangulated baseline that reconciles competing signals. We can observe several operational heuristics currently in use across major macro desks.
First, prudent analysts treat official NBS GDP as a ceiling during periods of acknowledged weakness and a floor during periods of acknowledged strength, recognizing the production-based methodology's smoothing tendencies. Second, the Li Keqiang Index is best deployed as a leading indicator for the industrial and credit cycle specifically, rather than as a wholesale substitute for headline GDP. Third, supplementary high-frequency datasets — container throughput at major ports, PMI surveys, property transaction volumes, and consumer confidence indices — are layered into the analytical framework to capture the services and household sectors that both primary metrics underrepresent.
Given the mandate to translate macroeconomic signals into portfolio positioning, we also note that divergence between the official figure and the proxy has direct implications for cross-asset allocation. When the Li Keqiang Index trends materially below official GDP, the empirical track record suggests caution on cyclically exposed Chinese equities, industrial commodities, and AUD-linked exposures. Conversely, when the proxy converges with or exceeds the official trajectory, risk-on positioning across the China complex tends to find more durable support.
Divergence between the NBS figure and the Li Keqiang Index is not a flaw in either dataset — it is the signal itself, telling us where the Chinese economy is genuinely under stress and where statistical confidence is thinnest.
Implications for the Forward Outlook
As we look toward the remaining quarters of 2024 and into 2025, the central question for global capital is whether the official 5% target represents a credible policy anchor or a political ceiling. The evidence suggests that the truth, as is often the case with Chinese macroeconomic data, lies somewhere in the triangulation between NBS aggregates, proxy indicators, and qualitative sector-level intelligence.
For the professional reader calibrating exposure to Chinese equities, sovereign credit, and the broader EM complex, the operational takeaway is straightforward: do not anchor on a single dataset. We can observe meaningful alpha generation in strategies that systematically weight the Li Keqiang Index, official GDP, and supplementary high-frequency indicators into a composite confidence score, then map that score against regional equity index performance and currency volatility. This approach has gained particular relevance given the recent recalibration of global rate expectations following the global stocks' strongest weekly gain since May, driven by US jobs data shifting the rate outlook — a development that has direct bearing on the relative attractiveness of Chinese risk assets in a shifting Fed trajectory.
The Li Keqiang Index will remain, for the foreseeable future, an indispensable tool in the macro strategist's analytical kit — not as a verdict on official data, but as a disciplined counterweight. In a market environment where central bank policy stances, sovereign yield curves, and equity index trajectories are increasingly interlinked across borders, the capacity to read Chinese economic signals with nuance is no longer optional. It is foundational to the work of mapping global capital flows in an era defined by structural transition and policy recalibration.